
一、简介
VGG网络在2014年的 ILSVRC localization and classification 两个问题上分别取得了第一名和第二名。VGG网络非常深,通常有16-19层,如果自己训练网络模型的话很浪费时间和计算资源。因此这里采用一种方法获取VGG19模型的模型数据,从而能够更快速的应用到自己的任务中来,
本文在加载模型数据的同时,还可视化图片在网络传播过程中,每一层的输出特征图。让我们能够更直接的观察网络传播的状况。
运行环境为spyder,Python3.5,tensorflow1.2.1
模型名称为: imagenet-vgg-verydeep-19.mat 大家可以在网上下载。
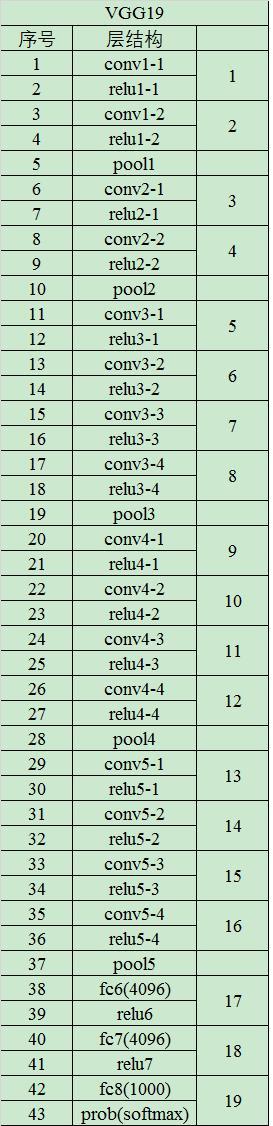
二、VGG19模型结构
模型的每一层结构如下图所示:
三、代码
这里只给出核心的输出图像代码,需要代码的,可以留言,加入社群得到。
#获取图像shape
shape =(1,input_image.shape[0],input_image.shape[1],input_image.shape[2])
#开始会话
with tf.Session()as sess:
image = tf.placeholder('float', shape=shape)
#调用net函数
nets, mean_pixel, all_layers = net(VGG_PATH, image)
#减均值操作(由于VGG网络图片传入前都做了减均值操作,所以这里也用相同的预处理
input_image_pre = np.array([preprocess(input_image, mean_pixel)])
layers = all_layers # For all layers \n",
# layers = ('relu2_1', 'relu3_1', 'relu4_1')\n",
for i, layer in enumerate(layers):
print("[%d/%d] %s"%(i+1, len(layers), layer))
features = nets[layer].eval(feed_dict={image: input_image_pre})
print(" Type of 'features' is ", type(features))
print(" Shape of 'features' is %s"%(features.shape,))
# Plot response \n",
#画出每一层
if1:
plt.figure(i+1, figsize=(10,5))
plt.matshow(features[0,:,:,0], cmap=plt.cm.gray, fignum=i+1)
plt.title(""+ layer)
plt.colorbar()
plt.show()
四、程序运行结果
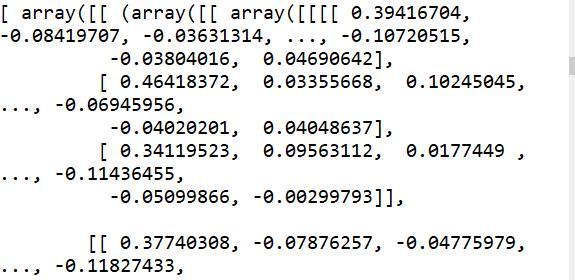
1、print(weights)的结果:
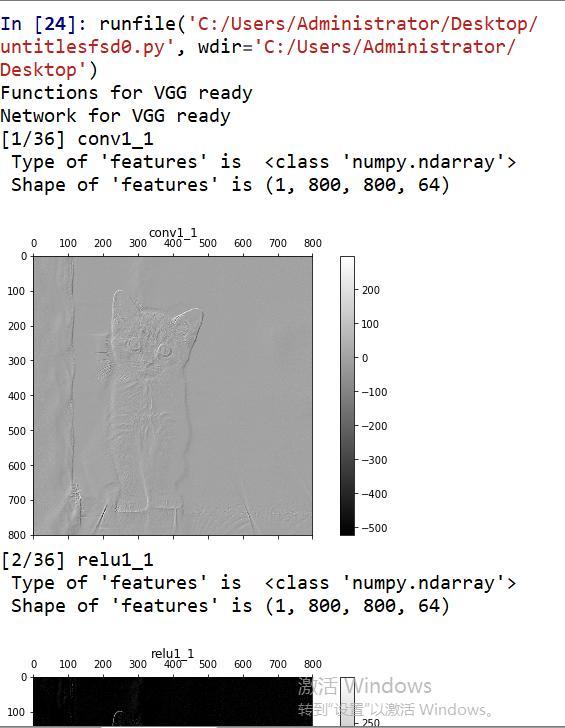
2、程序运行最终结果:
程序开始两层的可视化结果:
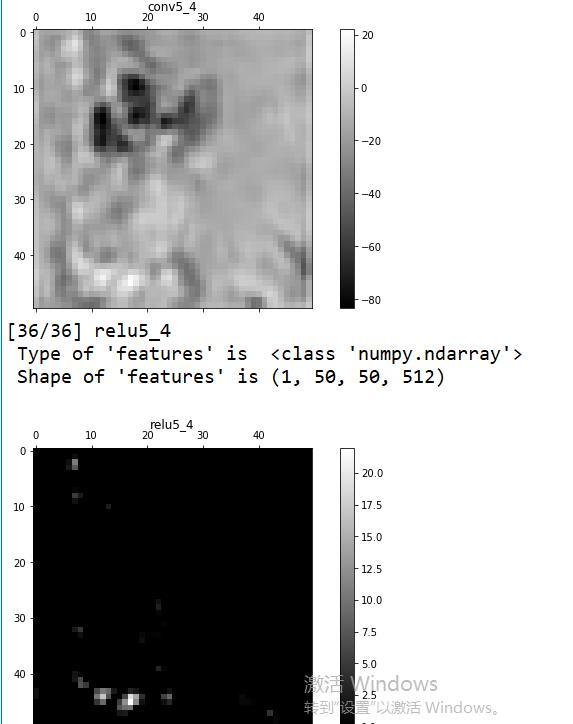
中间层数太多,这里就不展示了。程序最后两层的可视化结果:

头条号入驻

财经自媒体联盟


 第一财经日报
  每日经济新闻
  贝壳财经视频
  尺度商业
尺度商业  财联社APP
  量子位
量子位  财经网
财经网  华商韬略
华商韬略 
4000520066 欢迎批评指正
All Rights Reserved 新浪公司 版权所有
